import numpy as np
import matplotlib.pyplot as plt

r = np.arange(0, 2, 0.01)
theta = 4 * np.pi * r
fig, ax = plt.subplots(
  subplot_kw = {'projection': 'polar'}
)
ax.plot(theta, r)
ax.set_rticks([0.5, 1, 1.5, 2])
ax.grid(True)
plt.show()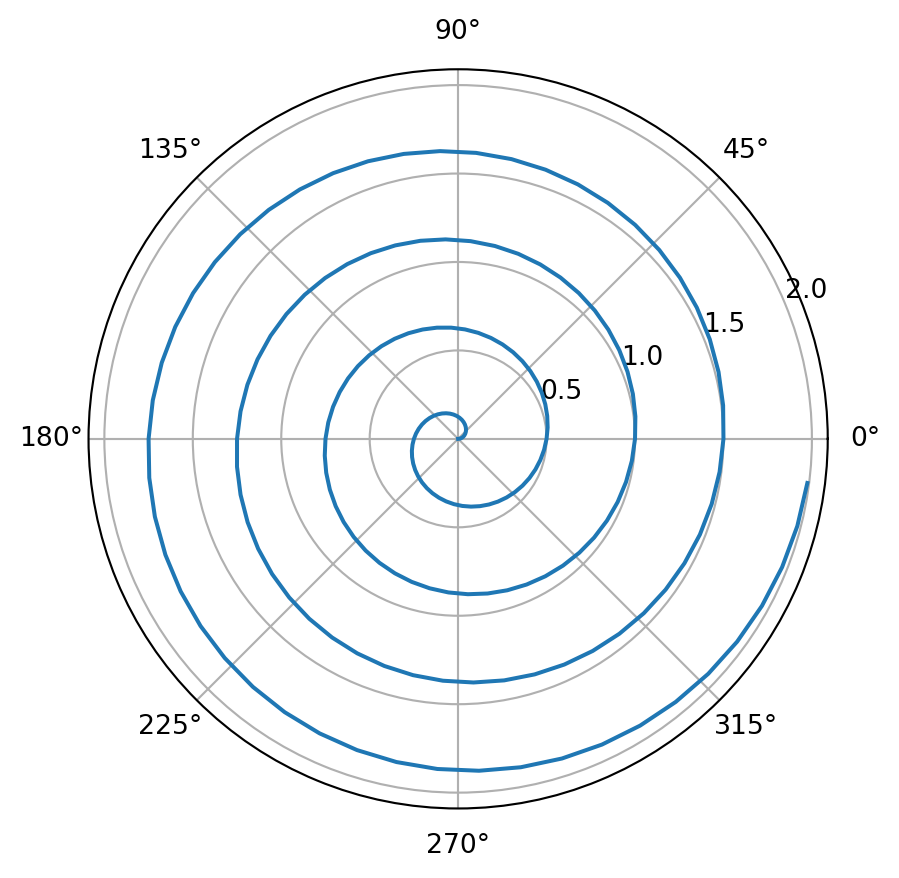
Template plot containing code blocks, markdown features, and plots.
For a demonstration of a line plot on a polar axis, see Figure 1.
import numpy as np
import matplotlib.pyplot as plt
r = np.arange(0, 2, 0.01)
theta = 4 * np.pi * r
fig, ax = plt.subplots(
subplot_kw = {'projection': 'polar'}
)
ax.plot(theta, r)
ax.set_rticks([0.5, 1, 1.5, 2])
ax.grid(True)
plt.show()# importing module
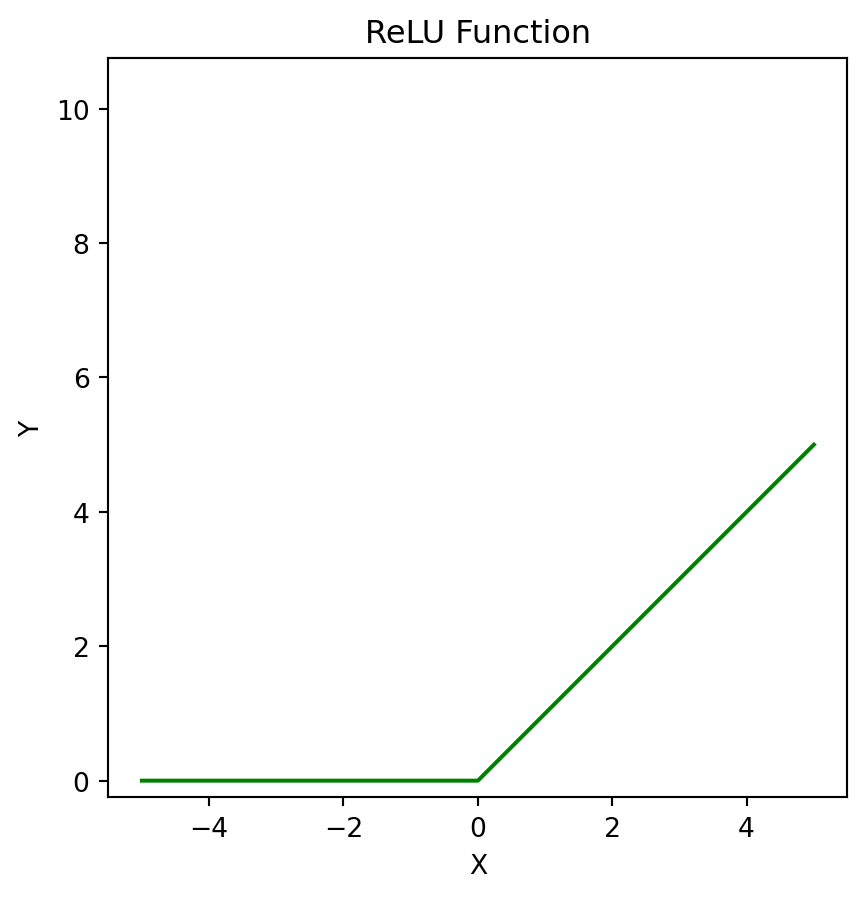
import matplotlib.pyplot as plt
# assigning x and y coordinates
x = [-5, -4, -3, -2, -1, 0, 1, 2, 3, 4, 5]
y = []
for i in range(len(x)):
y.append(max(0, x[i]))
# depicting the visualization
plt.plot(x, y, color='green')
plt.xlabel('X')
plt.ylabel('Y')
# square plot
plt.axis('square')
# displaying the title
plt.title('ReLU Function')Text(0.5, 1.0, 'ReLU Function')